- Home
- About
- Services
- Specialties
- Insights & News
- Client Logins & Payment Portal
- Events
- Contact
Reporting Solutions
Our team of consultants have the knowledge and skill set to create custom reporting solutions for your business.
Custom Reporting using Power BI
Increasingly, businesses are looking to bring multiple data streams together and report in a unified platform. It is typical for a business to have an operating system, accounting system and a data collection system.
They usually look like this:
- Operational System: an accounting system add-on or ERP with old, inflexible reporting analytics
- Accounting System: MYOB or Xero
- Data Collection: Excel or other cloud task list tool
What is the solution?
There are a multitude of reporting tools in the market. According to a recent Gartner magic quadrant report (Feb 2020), Microsoft Power BI and Tableau are clear leaders in this market, followed by Qlik and ThoughtSpot.
We recommend Power BI as it has multiple advantages, one of which is the power query tool built into the solution. Power query enables you to bring multiple data sources together and unify them into a single interactive reporting visual. Power BI dynamically changes the data as you select elements on the report making analysis and storytelling easy to do.
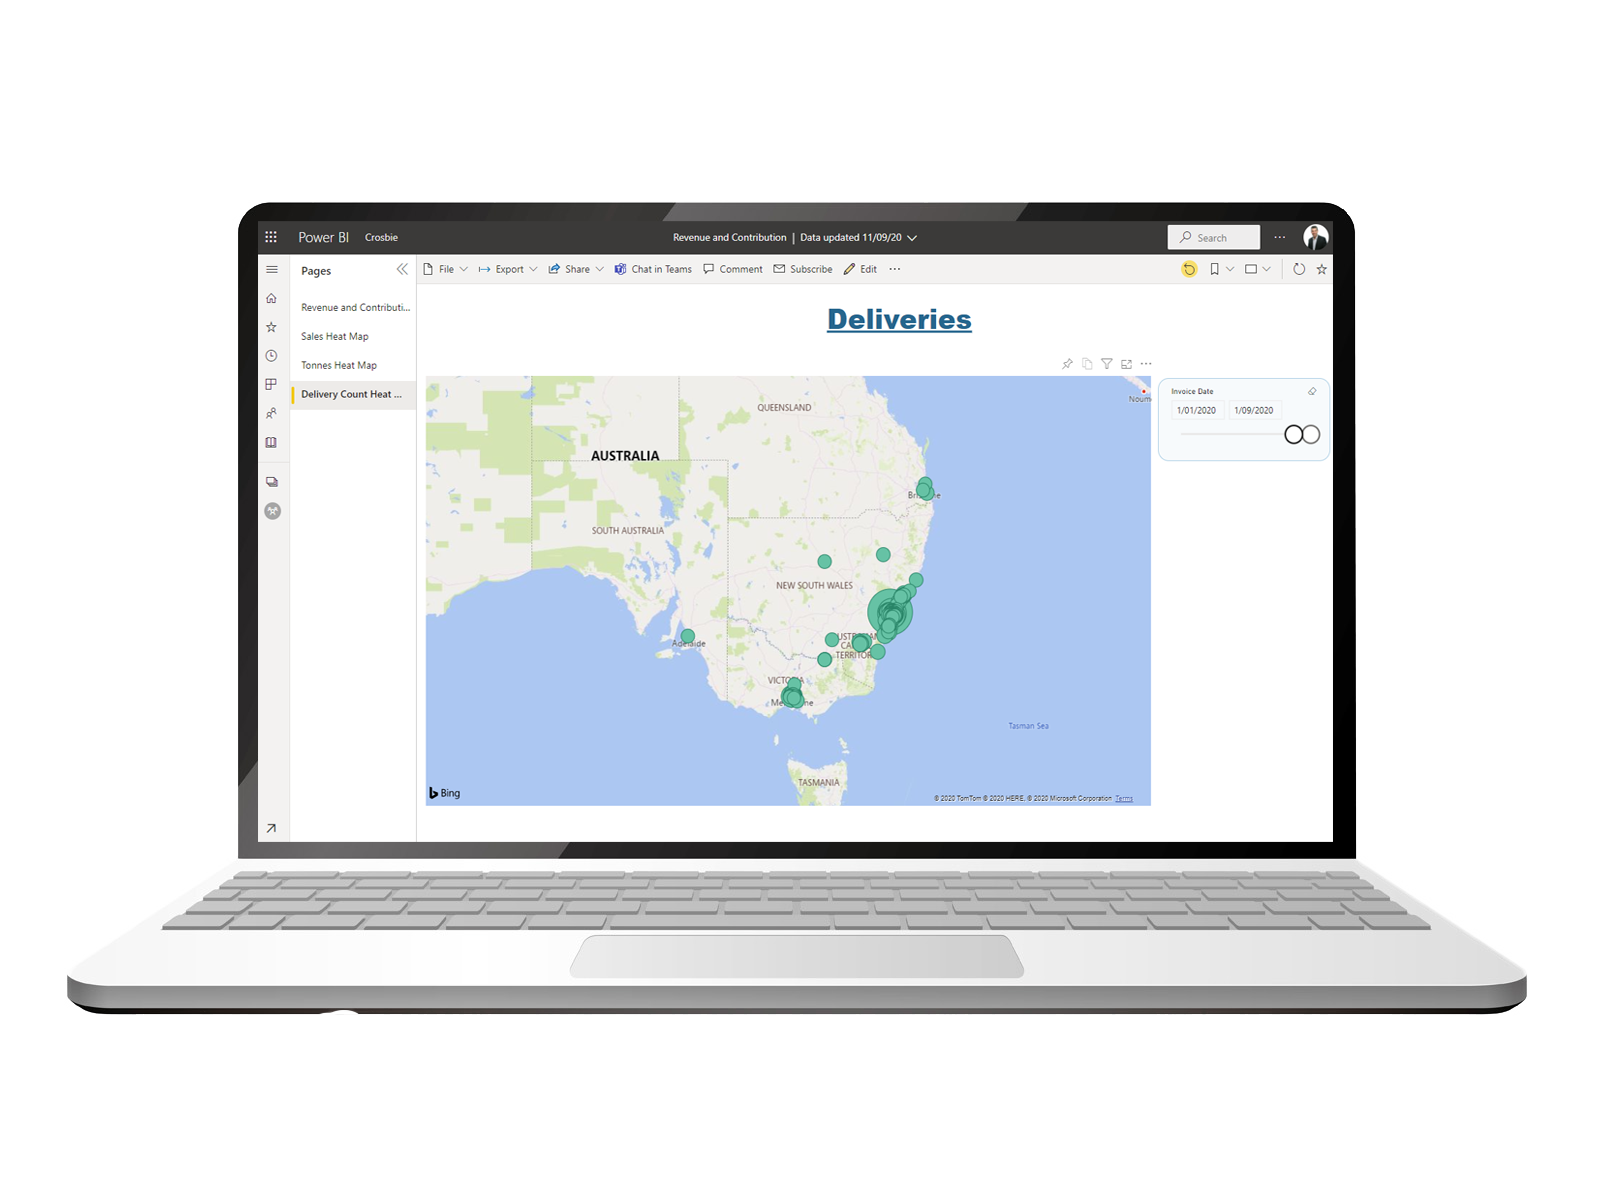
Heatmaps
Heatmaps utilise GPS coordinates and allow you to create visuals with insightful geographical data.
Common uses include customer sale location and customer delivery locations.
This type of data can help visualise delivery zones and target new customers in new regions
What's selling?
Visual reports that allow you to interact, drill through, and dynamically change to reflect criteria are extremely powerful information tools.
Built for sales teams, they allow end users to slice by product category, subcategory, customer, sales rep and specific items.
As you select one dimension, the other dimensions dynamically update.
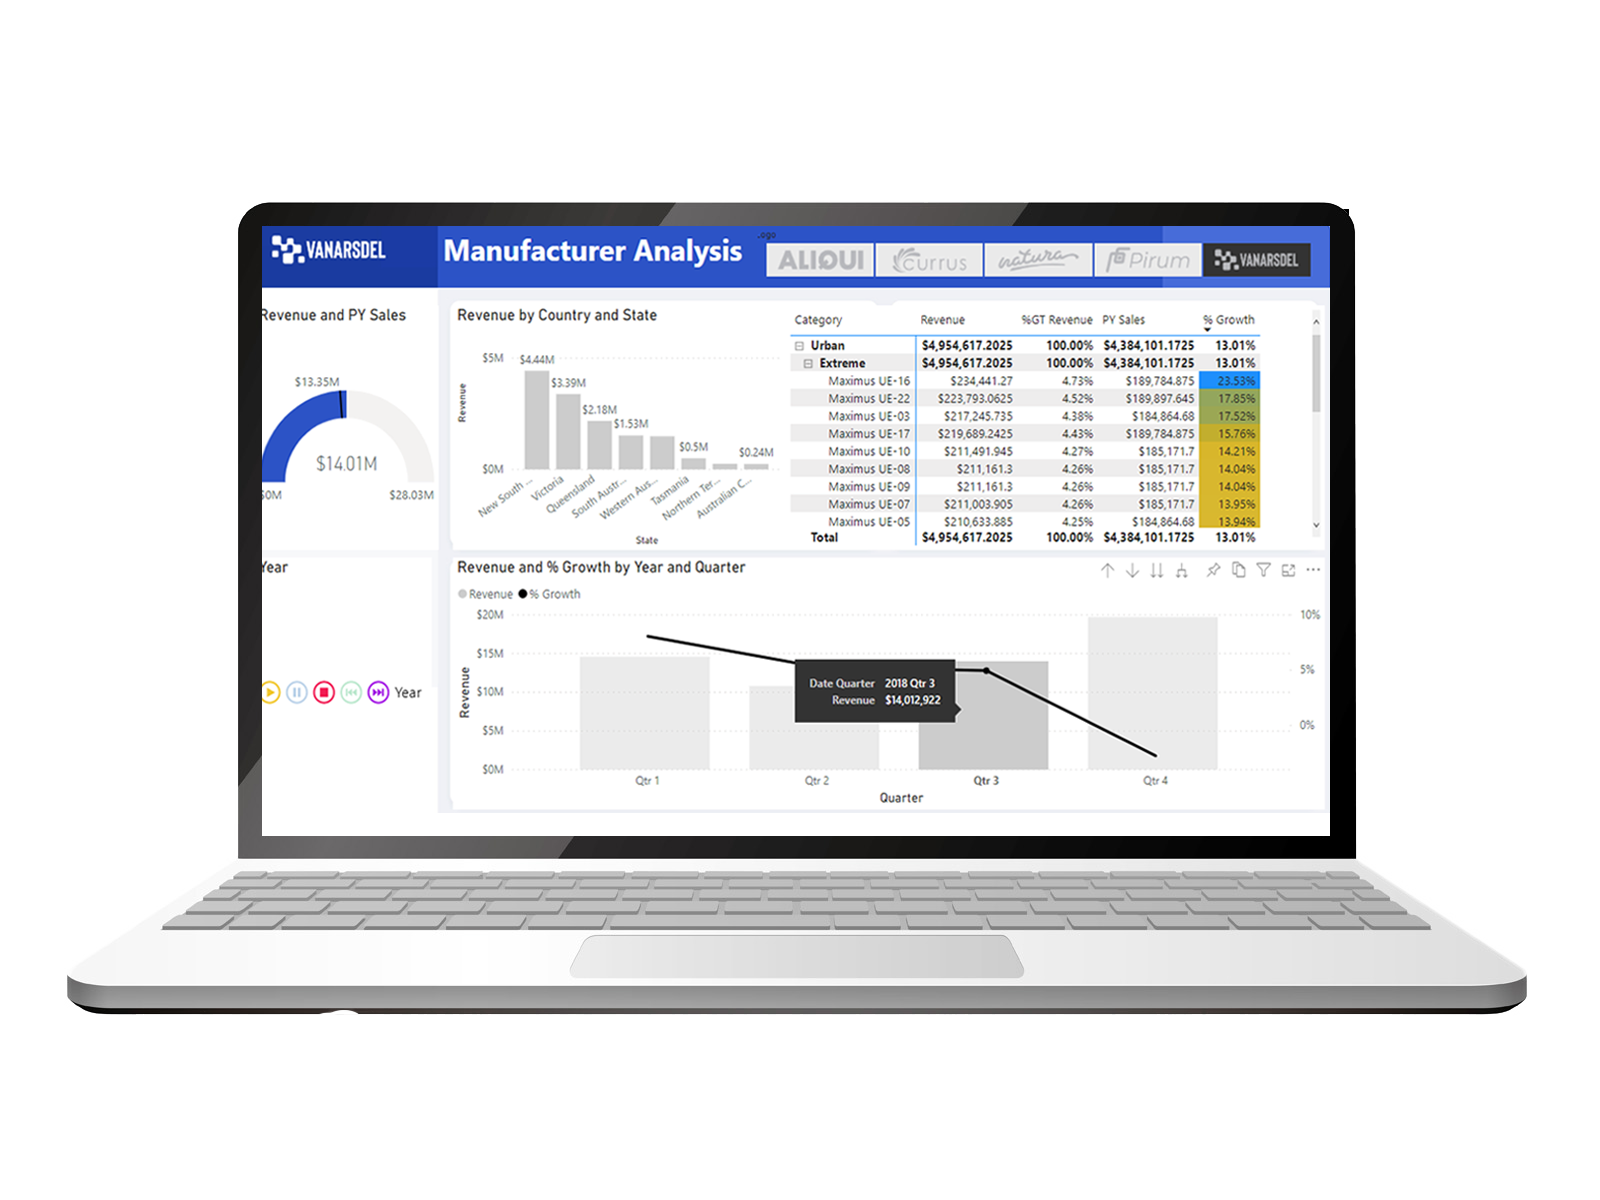
Ostendo Operational software Power BI reporting pack
Using Ostendo ERP Software?
We have extensive experience integrating Power Bi with Ostendo operational software, with utilisation, dead stock, revenue by category, actual versus budget and client retention dashboards and reports.
Xero reporting and other
applications
Power BI users can access multiple pre built reporting apps such as Xero accounting software, Sales Force, and Smart Sheets, just to name a few.
Once authorised, this apps come with pre built dashboards ready to go. Some apps require a subscription to unlock, but many are free.
BRISBANE
Suite 5, 36 Agnes Street,
Fortitude Valley, QLD, 4006
Australia
NEWCASTLE
Level 3, 130 Parry Street,
Newcastle West, NSW, 2302
Australia
SYDNEY
Suite 1102, Level 11, 20 Berry Street,
North Sydney, NSW, 2059
Australia
PHONE
1800 988 522
EMAIL
cnmail@cutcher.com.au


