
Pre-Open Data
Key Data for the Week
- Wednesday – US – Consumer Price Index rose 0.3% from the prior month and 4.3% from July 2020. This was lower than expectations.
- Thursday – US – Initial Jobless Claims
- Thursday – UK – Gross Domestic Product
- Thursday – EUR – Industrial Production
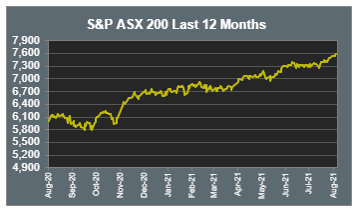
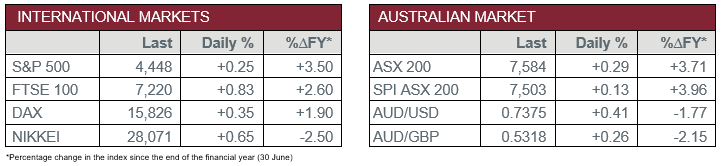
Australian Market
The Australian sharemarket rose 0.3% again yesterday, following strong performance in the Utilities, Energy and Financials sectors.
The Information Technology sector was a main laggard, as it fell 0.7%, mirroring the tech heavy NASDAQ following Tuesday’s session. Buy-now-pay-later providers experienced a slight pullback as Afterpay shed 0.8% and Zip Co. slid 2.1%. Meanwhile, tech heavyweight Xero declined 1.8%.
The Financials sector lifted 0.9%, led by Commonwealth Bank and ANZ, up 1.5% and 1.2%, respectively. Meanwhile, Westpac and NAB added 0.7% and 0.9%. Commonwealth Bank announced its cash profit totalled a whopping $8.65 billion (FY21), which represented a 19.8% increase, and that it would enter into shareholder buybacks and payouts totalling $10 billion.
Utilities was the top performer on Wednesday as the sector climbed 1.9%. Key gainers were Origin (3.8%) and Sparks Infrastructure (1.1%). Meanwhile miners also did well, despite weakening iron ore prices, with the Materials sector up 0.9%. The major miners BHP and Rio Tinto rose 1.5% and 1.3% respectively; while lithium miners experienced strong gains as Pilbara Minerals rose 5.2% and Orocobre climbed 6.3%.
The Australian futures point to a 0.13% rise today.
Overseas Markets
European sharemarkets continue to hit record highs, as the STOXX 600 rose 0.4%, marking an eighth consecutive session of gains. Meanwhile, the German DAX and UK FTSE 100 rose 0.4% and 0.8%. European market sentiment seems sanguine, despite potential monetary policy tightening and the spread of COVID-19’s Delta variant.
US sharemarkets advanced overnight, as weaker-than-expected core inflation results eased worried investors. The Materials (1.4%) and Industrials (1.3%) sectors led the advance, with 10 out of 11 industry groups closing higher. The Information Technology sector weakened; Apple rose 0.2%, while Alphabet and Amazon shed 0.3% and 0.9% respectively. A key detractor was cloud-based security company CrowdStrike, which fell 5.1%.
By the close of trade, the NASDAQ lost 0.2%, while the S&P 500 and Dow Jones rose 0.3% and 0.6% respectively; indicating investors might be shifting from growth to cyclical stocks.
CNIS Perspective
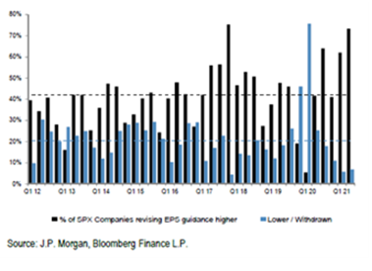
Across both US and Europe, company earnings have been higher than expected. That is, higher than forecasts and higher than last year.
In the US, earnings per share growth is over 93% higher year on year and Europe is over 74% higher. In the US, 86% of S&P 500 companies have reported higher earnings per share than estimates, while in Europe, 65% of STOXX 600 companies have beaten earnings estimates.
On the surface, this is impressive data. However, the data needs to be read relative to the economic backdrop of the past year.
In the midst of a global pandemic and patchy recovery, it seems logical that earnings estimates would be on the conservative side. Compared to last year’s earnings data, when COVID-19 had most of the developed economies in lockdown, it would be disappointing if the earnings hadn’t grown substantially from a year ago.
What’s somewhat more comforting is the forward guidance of company earnings, which is strong. The proportion of companies making upward revisions to their earnings per share guidance is near decade highs.
Should you wish to discuss this or any other investment related matter, please contact your Investment Services Team on (02) 4928 8500.
Disclaimer
The material contained in this publication is the nature of the general comment only, and neither purports, nor is intended to be advice on any particular matter. Persons should not act nor rely upon any information contained in or implied by this publication without seeking appropriate professional advice which relates specifically to his/her particular circumstances. Cutcher & Neale Investment Services Pty Limited expressly disclaim all and any liability to any person, whether a client of Cutcher & Neale Investment Services Pty Limited or not, who acts or fails to act as a consequence of reliance upon the whole or any part of this publication.
Cutcher & Neale Investment Services Pty Limited ABN 38 107 536 783 is a Corporate Authorised Representative of Cutcher & Neale Financial Services Pty Ltd ABN 22 160 682 879 AFSL 433814.
