The September Effect

Markets move lower during seasonally weak period

Table of contents


Quick Take

Global financial markets traded lower in September due to rising oil prices and bond yields. Equity market volatility also increased.

September is historically weak for stock returns, known as the "September Effect", but October to December often see stronger performances.

Oil and iron ore prices rose, with a significant 21% oil price surge over the last three months due to production cuts
by Saudi Arabia and Russia, extended until the end of 2023.

It remains to be seen whether market movements in September are the beginning of a new trend, or if the coming
months will revert to their usual seasonal patterns. 


Snapshot

Global financial markets experienced a textbook September, trading lower during the month in response to higher oil prices and higher bond yields.

Market volatility, as measured by the CBOE Volatility or VIX index, rose to 17 after starting the month around 13.

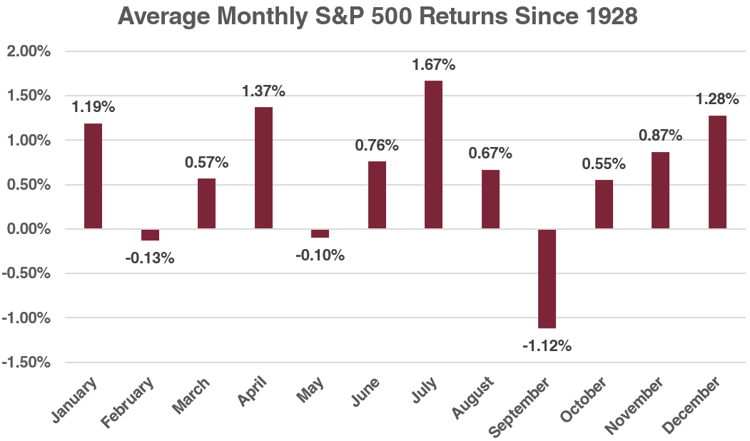
Historically, the month of September is known for its weak stock market returns, a phenomenon often referred to as the "September Effect". Since 1928, the S&P 500 index has, on average, fallen by 1.12% during this month. However, it is worth noting that despite September's historical downturns, the subsequent months of October, November, and December have typically witnessed stronger returns, with increases of 0.55%, 0.87%, and 1.28% respectively.

The commodities market also saw shifts in September. While most commodities experienced a decline, oil and iron ore stood out with increases of 2.4% and 1.1% respectively.

The surge in oil prices over the past three months, amounting to a 21% increase, can be attributed to significant production cuts from Saudi Arabia and Russia. These nations voluntarily reduced their oil production by 1.5 million barrels a day in July to counteract declining fossil fuel demand and support prices.

Average Monthly S&P 500 Returns Since 1928 Graph

Contact us today!

Crude Oil Price - Last 6 Months Graph

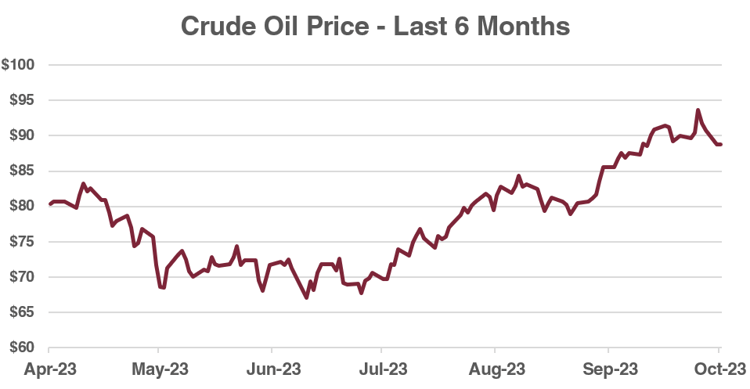
Though this reduction was initially intended as a short-term measure, it has been extended to last until the end of 2023. Additionally,  these voluntary cuts came on top of the production reductions agreed upon by OPEC+ in June.

There are potential risks associated with these market dynamics. If oil prices remain higher for longer, they will contribute to more persistent inflation and counteract restrictive monetary policy from central banks.

Elevated oil prices keep pressure on household budgets, both directly via petrol and indirectly through other goods and services, as increased costs of goods lead companies to raise prices and maintain profit margins. 

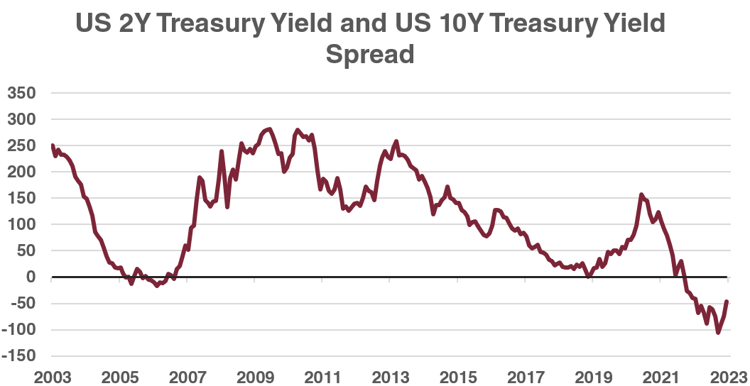
Bond yields rose accordingly,  with the yield on the 2-year US Treasury rising by 0.22% to 5.11%, and the yield on the 10-year US Treasury rising by 0.49% to 4.68%.  Interestingly, the US yield curve also remains inverted, signalling slower economic growth ahead, with the 10-year US Treasury yield of 4.68% trading below that of the 2-year US Treasury yield of 5.11%.

As we move forward, it remains to be seen whether market movements in September are the beginning of a new trend, or if the coming months will revert to their usual seasonal patterns. If the seasonal narrative holds up, the fourth quarter can often lead to a “Santa Claus” rally and strong equity market returns.

US 2Y Treasury Yield Graph


Key Stocks

Agnico Eagle Mines logo

Agnico Eagle Mines Limited

Cutcher & Neale International Shares Model

Agnico Eagle Mines Limited is a Canadian gold miner, founded in 1957 and is now the world’s third largest gold miner by production.

The gold mining company has a large focus on operating in low-risk jurisdictions, with production operations in Canada, Australia, Finland and Mexico, along with projects in the US and Colombia.

The Investment Committee agreed to add Agnico Eagle Mines to the portfolio to provide exposure to gold, due to the protection benefit it can provide to the portfolio should market volatility be experienced.

Furthermore, the company has a low all-in sustaining cost of around US$1,100 per ounce of gold produced, which is lower than the industry average, along with around 15 years of gold reserves at the end of last year, highlighting the strength of the company. 

Eli Lilly and Company logo

Eli Lilly and Co

Cutcher & Neale International Shares Model

Eli Lilly and Co is an American pharmaceutical company, with exposure in 125 countries around the world. Eli Lilly focuses on neuroscience, cardiometabolic, cancer and immunology, with strong entrenchment in diabetic medications.

More recently, the company has expanded into obesity management through the use of GLP-1, which was originally used in the treatment of diabetes, however, the drug has now gained traction with weight loss. The drug called Mounjaro, along with Donanemab (used to treat Alzheimer’s), is projected to account for half of Eli Lilly’s sales by the end of the next 10 years.

The Investment Committee decided to add Eli Lilly to the portfolio to increase exposure in the defensive healthcare sector, as the company becomes one of the big market players, particularly in regard to its research into Alzheimer’s and weight loss management.

About The Author

Wade is the head of the Investment Services division at Cutcher & Neale and has over 10 years of industry experience in accounting and investment advisory roles.

Wade guides his division on the belief that investment portfolios should be built on transparency and flexibility. His expertise focuses on direct portfolio exposure to both Australian and Global Investment markets.

The information in this publication contains general advice only. It has been prepared without taking your personal objectives, financial situation or needs into account. You should consider whether the information contained within this publication is appropriate for you. Where we refer to a financial product you should obtain the relevant Product Disclosure Statement or offer document and consider it before making any decision about whether to acquire the product.