
Pre-Open Data
Key Data for the Week
- Monday – UK – Rightmove House Prices climbed 0.3% in June, however, growth slowed over the year from 10.2% to 9.7%.
- Tuesday – AUS – RBA Board Meeting Minutes
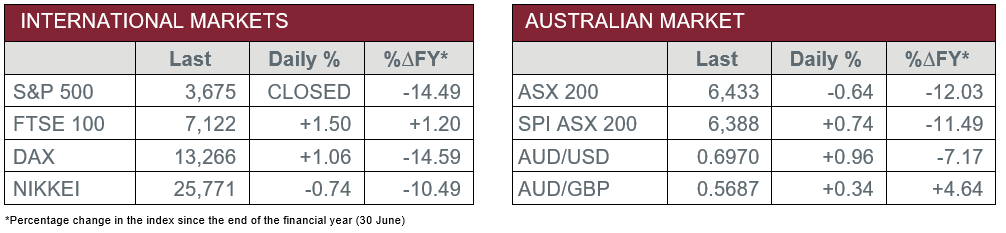
Australian Market
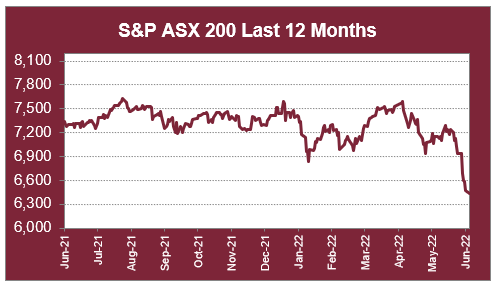
The Australian sharemarket continued its recent weakness on Monday, as fears of slowing economic growth around the world dampened investor sentiment.
The Materials sector slipped, as the price of iron ore dropped 4.9% to sit at US$125 per tonne. Fortescue Metals was the weakest among the major miners, down 8.6%, while BHP and Rio Tinto conceded 5.3% and 5.1% respectively. Lithium miners also lost ground; Pilbara Minerals lost 2.9% and Allkem closed the session 0.5% lower.
The price of oil declined to lead the Energy sector lower, following a decreased outlook for fuel demand given the potential decline in economic growth. As a result, Woodside Energy dropped 4.9% and Santos lost 6.0%, while Beach Energy shed 8.3%.
The Financials sector bucked the downward trend, after the sector had been heavily weakened in prior trading sessions. ANZ added 1.1%, while NAB and Commonwealth Bank rose 0.5% and 0.3% respectively. However, Westpac closed the session relatively flat.
The Australian futures market points to a 0.74% gain today, driven by stronger overseas markets.
Overseas Markets
European sharemarkets finished higher on Monday, led by the Financials and Travel & Leisure sectors. The major banks enjoyed gains; Barclays and Deutsche Bank both added 2.8%, while BNP Paribas closed the session 1.3% higher. Among travel stocks, International Consolidated Airlines Group jumped 7.4%, while Lufthansa added 7.6%.
By the close of trade, the STOXX Europe 600 gained 1.0% and the German DAX lifted 1.1%, while the UK’s FTSE 100 added 1.5%.
US sharemarkets were closed overnight for Juneteenth National Independence Day.
CNIS Perspective
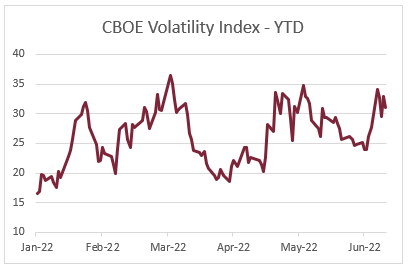
If we review the CBOE Volatility Index (fear index) for the year so far, it’s been an abnormally volatile one, not only under normal market conditions, but when compared to other sell-offs as well.
So far, roughly 20% of trading sessions on the US S&P 500 have seen price movements greater than 2%, which is well above the average of 8% of annual trading days over the past 20 years of compiled data.
The Volatility Index has averaged 26 in 2022 to date (persistently above the long-term average of 18) and currently sits at 33.
The one outlier to these elevated results however is ‘peak’ volatility, with the fear level reaching a high of 36 on 7 March, a positive sign of less ‘panic-selling’ throughout this bear market when compared to the peak in both the COVID-19 sell-off and GFC, where both saw readings in excess of 80.
There is no doubt the indecisiveness around central bank policy settings has added to this volatile market, with actions being reactive rather than proactive, adding to fear experienced in the market, keeping the Volatility Index elevated for a longer period than usual.
Should you wish to discuss this or any other investment related matter, please contact your Wealth Management Team on (02) 4928 8500.
Disclaimer
The material contained in this publication is the nature of the general comment only, and neither purports, nor is intended to be advice on any particular matter. Persons should not act nor rely upon any information contained in or implied by this publication without seeking appropriate professional advice which relates specifically to his/her particular circumstances. Cutcher & Neale Investment Services Pty Limited expressly disclaim all and any liability to any person, whether a client of Cutcher & Neale Investment Services Pty Limited or not, who acts or fails to act as a consequence of reliance upon the whole or any part of this publication.
Cutcher & Neale Investment Services Pty Limited ABN 38 107 536 783 is a Corporate Authorised Representative of Cutcher & Neale Financial Services Pty Ltd ABN 22 160 682 879 AFSL 433814.
